John Hayes
Observability Advocate, SquaredUp

Getting started with SquaredUp is free and easy. Our free tier includes:
Using SquaredUp’s Prometheus plugin to track the essential signals for Kubernetes monitoring.
Observability Advocate, SquaredUp
Kubernetes is a large and complex platform used to run critical enterprise workloads. It can generate huge amounts of telemetry and has many moving parts, which can be difficult to keep track of. In this article, we will show how Prometheus and SquaredUp combine to provide the perfect monitoring solution for Kubernetes. We’ll be leveraging SquaredUp’s Prometheus plugin, which is one of the 70+ plugins SquaredUp offers.
Let’s take a look at some example dashboards you can easily create.
If you prefer, you may watch this video where I explore the contents of this article in a little more depth.
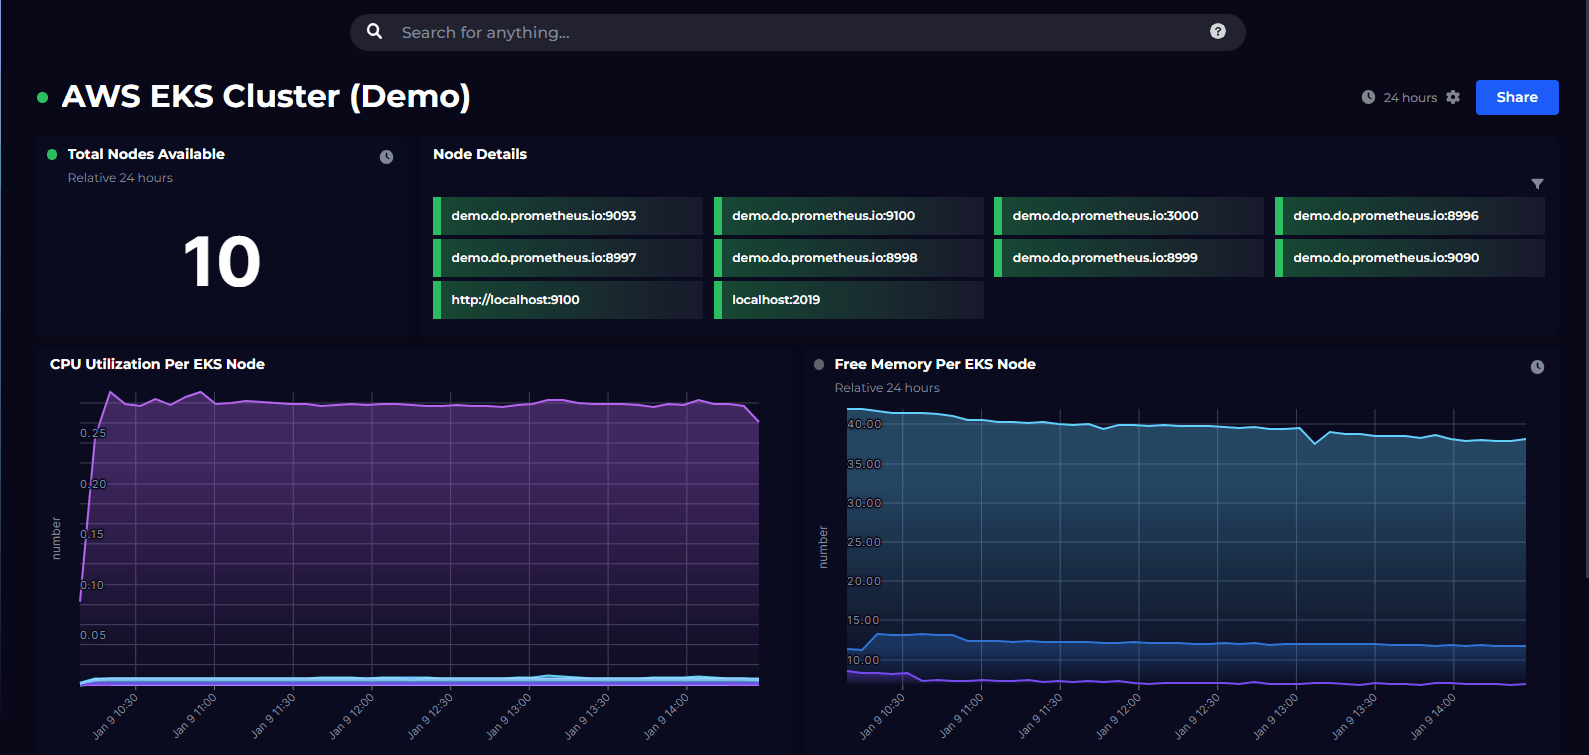
Our first dashboard is a Cluster overview. As a DevOps Engineer or Platform Engineer you may be managing a large number of clusters. So, the first thing that you want is to get an overview of the cluster. This dashboard is designed to give you a profile of the cluster so that you can get an immediate impression of its size and shape.

Straight off the bat, I can see the number of nodes and the Kubernetes version, which is critical for ensuring that I am using a supported version of Kubernetes. I also get two donut charts which give me an indication of how many pods are running and how they are distributed.
Prometheus ships with a number of built in checks for Kubernetes health. I can surface these incredibly easily in my dashboard – all I need to do is use the Alerts Stream in the SquaredUp Prometheus plugin. With a couple of clicks it will visualize these alerts without me having to write a single line of code.
Having taken in a high-level view of our cluster, our next concern is the health of our nodes. Kubernetes is a control plane that spans one or more physical or virtual machines. In the dashboard below, we see a number of metrics essential to ensuring the health of these nodes:

On the top row of this dashboard, you can see a SquaredUp block visualisation. In this instance the blocks are tracking the health of each of the individual nodes in our cluster. At a glance, I can see that I have three nodes in my cluster and that they are all up and running and healthy.
Next, I am interested in looking more closely at performance. Again, using a simple Prometheus query and a SquaredUp line graph visualisation, I can check a number of key performance metrics.
In this case I can see that one of my nodes is experiencing high levels of both CPU and memory usage. I have seen in the previous dashboard that my pods are distributed quite evenly amongst my nodes. This makes me wonder if there is a particular pod or service that is using up an excessive amount of resources. So, maybe we should move on to our next level of analysis – pods and services.
If you are administering a K8S cluster, one of the most common commands you will run when troubleshooting is a query to check which pods are using the most resources. We have reproduced this logic in our Pod Health dashboard. At a glance you can see the top five pods for:
· Memory
· CPU
· Network in
· Network out

I can immediately see that the load generator pod is consuming very high levels of both CPU and memory – and that is something I will definitely want to check out. In the top right of this dashboard, we have a table listing pod restarts – a critical metric for Kubernetes admins. Whilst a restart may be down to something benign, such as a rolling update of pods, it can also be the symptom of a serious problem
CrashloopBackOff generally tells me that there is a problem either finding or loading the container, so the pod cannot start. Another critical issue is OOMKills – an OOMKill occurs when a container exceeds its memory limit. This requires immediate investigation as an OOMKill can occur in the middle of a transaction or request meaning an outage in a part of our system.
The final health indicator I am interested in is the state of my deployments. We monitor this at two levels. First, we look at the pods in our cluster and check that all of the containers that were scheduled for a pod are running. Normally, there is only one container in a pod but sometimes the principal container uses a sidecar or helper container.

We can see here that the alert manager and flagd pods each have two containers scheduled and they are both running. In this table we also have a state column – which gives us an immediate visual cue. This uses a SquaredUp State field which is a really powerful way of mapping a value in a field to a state such as success, warning or error.
On the right-hand side, we are running a similar check. This time we are verifying that the number of pods running for each deployment matches the value that we have specified in our configuration. If we see an error here it can indicate either a pod crash or a problem with a new deployment. Happily, everything looks good.
In this article we have just concentrated on monitoring Kubernetes using the SquaredUp Prometheus plugin. In addition to this, SquaredUp has 70+ plugins to help give you a complete view of activity in your Kubernetes cluster. This includes plugins for concerns such as cost, availability, log analytics and more.
If you don’t have a SquaredUp account, don’t worry – you can sign up for our Free Forever tier and be creating smart dashboards in minutes.