Blog


We did it! SquaredUp is now a B Corp
It's been a journey - but we're delighted to finally announce our B Corp certification. Here's the story of how it happened...
Top 5 dashboards for DevOps leaders
How DevOps leaders can use SquaredUp to view SLOs and key metrics in a single pane of glass.
Operational Intelligence - the new horizon of observability
The evolution of observability into intelligent, real-time decision-making.

How Evidi built the perfect MSP single pane of glass
Evidi has created the ideal suite of dashboards for MSPs – a customer health overview dashboard that drills into one workspace per customer. Learn more.


Latest blogs

How-to surface your multi-cloud costs with SquaredUp
Learn how to use SquaredUp to create a dashboard to visualize and monitor combined cloud costs.
Combining AWS and Prometheus with OpenTelemetry
Learn about OpenTelemetry's naming conventions and how they help consolidate data from disparate systems like AWS and Prometheus.
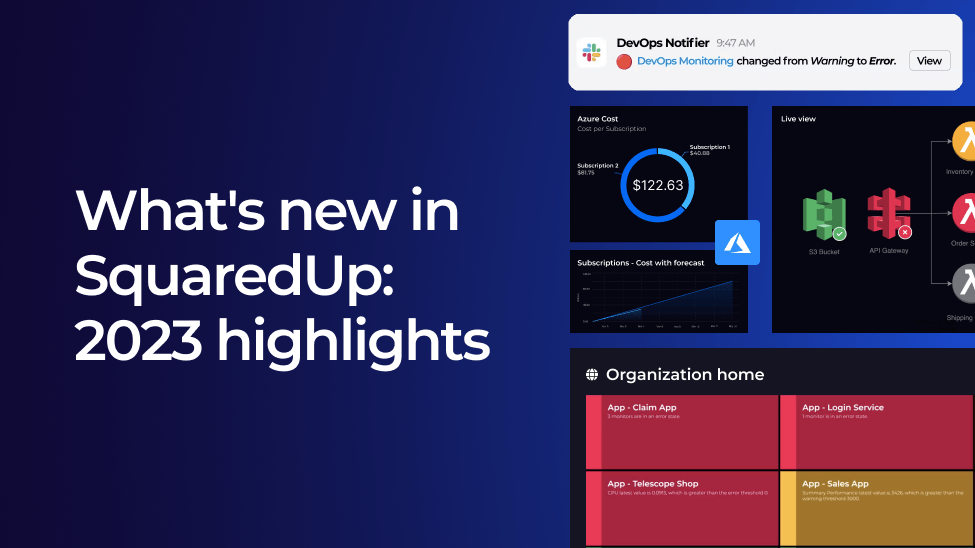
What's new in SquaredUp: 2023 June – Dec highlights
Explore this years most impressive product enhancements, from brand new plugins, exciting visualizations and even more out of the box dashboards.
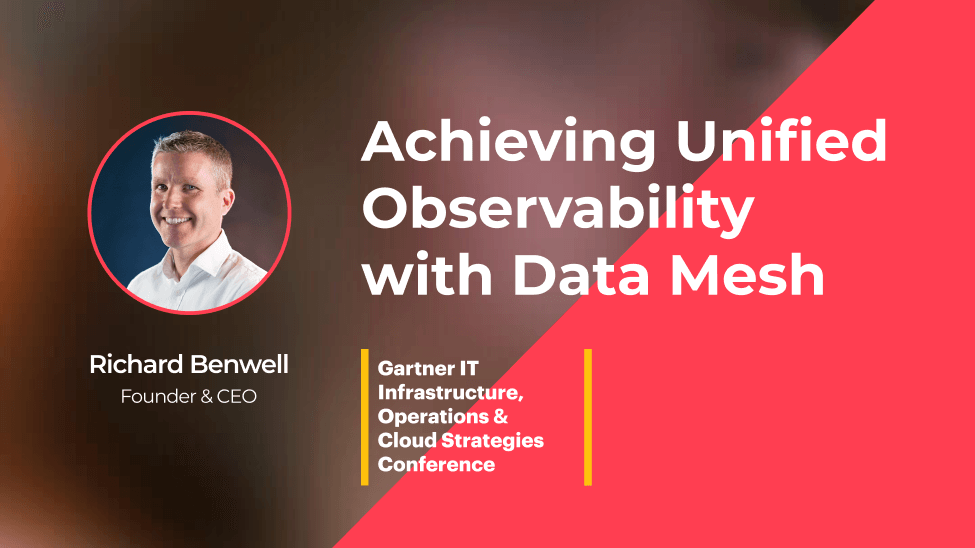
Gartner IOCS replay: achieving unified observability with data mesh
Understand what’s powering the drive for a single pane of glass in enterprise observability, what challenges we're facing, and how SquaredUp solves these challenges.

How to measure engineering team health
As engineering managers, we want to understand our team's "health" to help them be happier and more productive. But what should we measure and track?
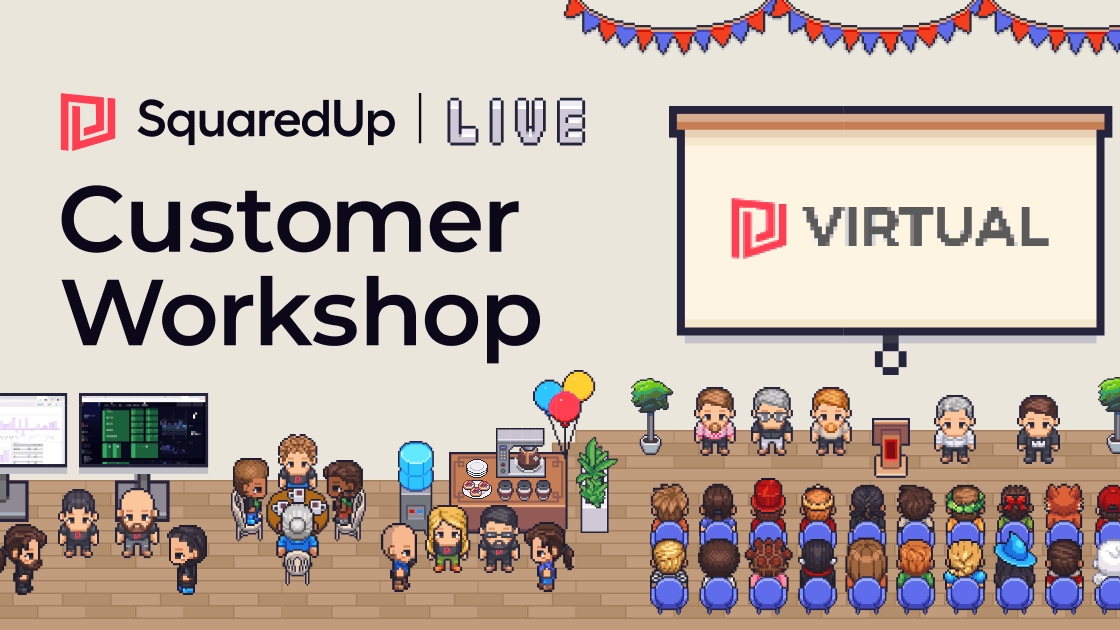
Virtual Customer Workshop 2023
We invited customers from all around the world to meet the team and learn about new product updates at our first ever virtual customer workshop!

Dashboarding Azure Monitor SCOM MI in SquaredUp
Microsoft have just dropped SCOM MI, their cloud-based version of SCOM. Learn how SquaredUp enhances SCOM MI reporting, and how easy it is to get set up.

Introducing the Notification API
Everyone loves a dashboard. But real magic is when your awesome dashboard comes to you, where you need it, when you need it.

We are officially a Great Place to Work for 2023!
We've been ranked in the top five on the list of UK's Best Tech Workplaces (Medium). Hurray!
Head Based Sampling using the OTEL Collector
In this article I demonstrate how to implement head based sampling of your traces using the OpenTelemetry collector.
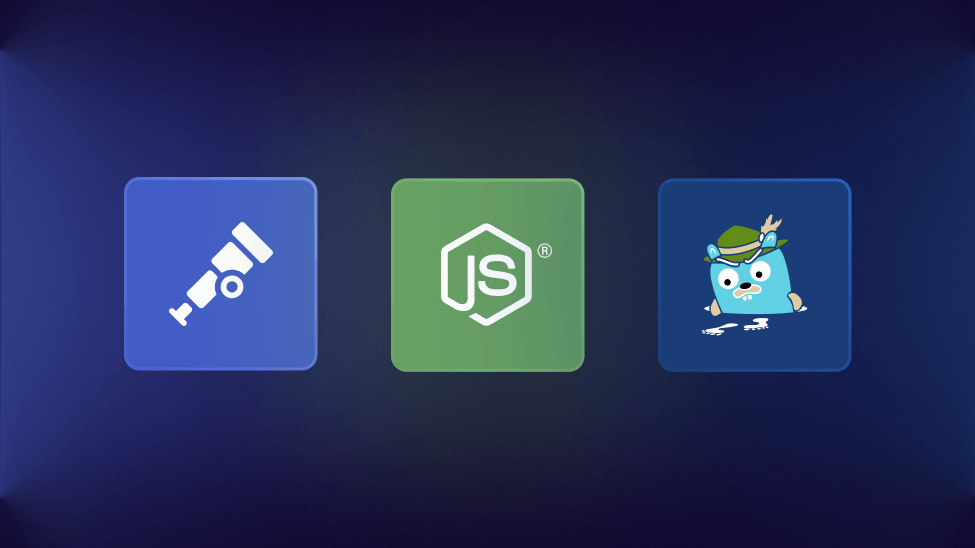
Getting Started with the OpenTelemetry Collector
In this article you'll learn how to run the OpenTelemetry Collector in Docker, send spans to it, and then direct those spans to Jaeger.
The Single Pane of Glass in Modern Observability
What is a single pane of glass? Does it have practical applications? How does it fit into modern observability?
