Blog


A dive into health roll-up
SquaredUp dashboards sit on top of some very powerful technology. Read to learn all about our health model and how it can benefit you.
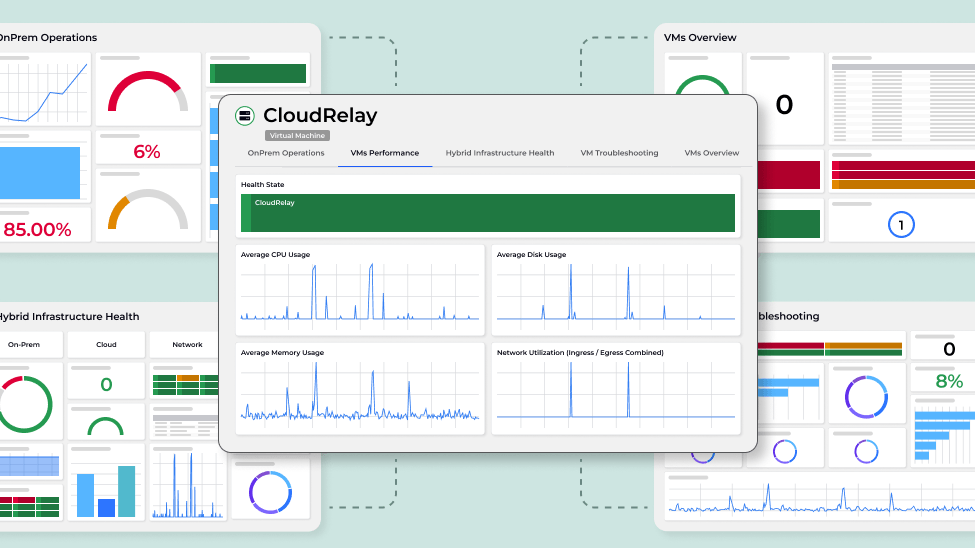
A new perspective on dashboard sprawl
Ditch your static, outdated dashboards! Our smart dashboards collate and show you the data that matters. Read to learn about the feature that powers the magic.

How to build the ideal engineering team dashboard
What makes a good engineering team dashboard? Follow this guide to help your developers focus more on coding and spend less time on tool switching.

SquaredUp celebrates four years as a certified Great Place To Work®
We’re thrilled to share that we’ve once again been recognized by Great Place To Work® across multiple categories for 2025!


Latest blogs

The 3 smart updates to our Jira plugin
We’ve supercharged our Jira integration – making dashboards faster, data streams simpler, and your workflow smoother than ever.

Our latest Pingdom data improvements - to get more from your monitoring
We made some updates to our Pingdom plugin, so you can finally see the bigger picture, spot issues faster, and keep your whole team in the loop.

Getting started with SolarWinds Orion dashboards
How to create impactful dashboards for SolarWinds Orion using the native SquaredUp plugin.

Getting started with ServiceNow dashboards
How to create impactful dashboards in SquaredUp using the native ServiceNow plugin.

SQL analytics - unified querying across any API
How to use the SquaredUp's SQL analytics engine to query any kind of data.
Top 3 tools for DORA metrics reporting: SquaredUp vs Power BI vs Jira
Compare the top tools for DORA metrics reporting – SquaredUp, Power BI, and Jira-and discover how to improve your DevOps performance with actionable insights.

Getting started with Jenkins dashboards
A guide to creating impactful dashboards for Jenkins on SquaredUp.

Azure DevOps agent pools: diving deeper
Get deep visibility of Azure DevOps agents and pools with the SquaredUp Azure DevOps plugin

A simple new way to visualize Prometheus
Our latest Prometheus integration brings the simplicity and flexibility of SquaredUp dashboards to the world of Prometheus and Kubernetes monitoring.
Getting started with AWS dashboards
How to create impactful AWS dashboards easily using the AWS plugin in SquaredUp.
Top 3 tools for Azure cost reporting: SquaredUp, Azure Cost Management, & Power BI
Looking to get a handle on your Azure costs? We compare SquaredUp with two other leading tools to see which comes out on top.
Getting started with InfluxDB dashboards
Follow our steps to creating insightful dashboards using the InfluxDB plugin in SquaredUp.
