Blog


We did it! SquaredUp is now a B Corp
It's been a journey - but we're delighted to finally announce our B Corp certification. Here's the story of how it happened...

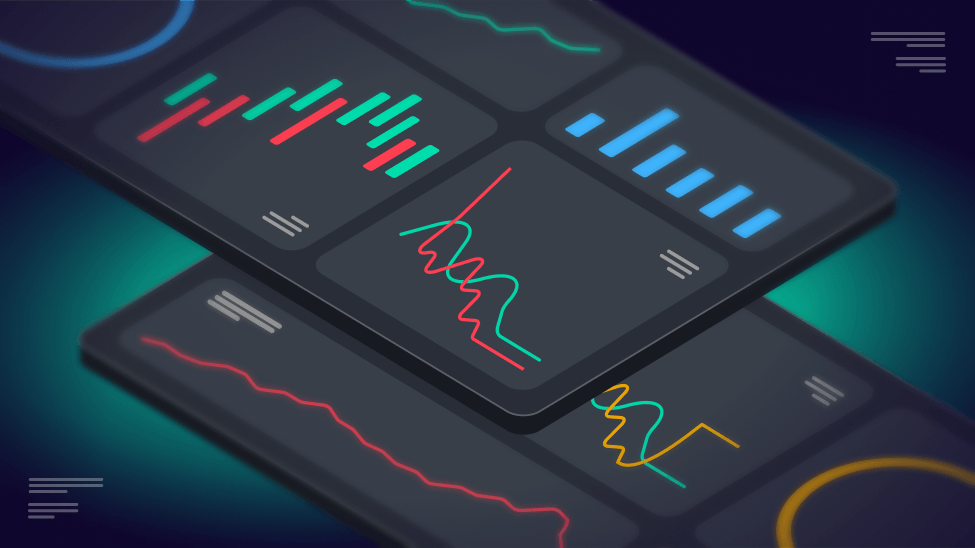
Top 5 dashboards for DevOps leaders
How DevOps leaders can use SquaredUp to view SLOs and key metrics in a single pane of glass.

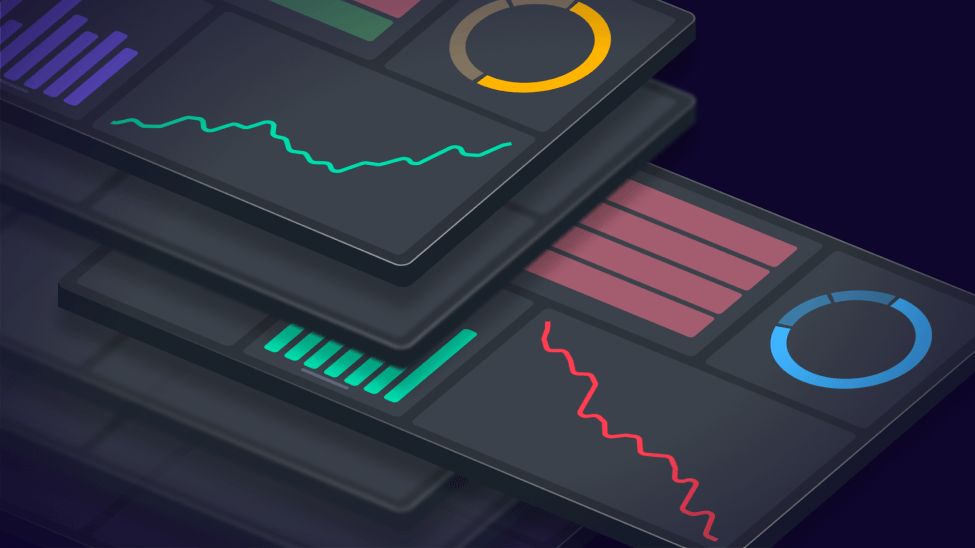
Operational Intelligence - the new horizon of observability
The evolution of observability into intelligent, real-time decision-making.

How Evidi built the perfect MSP single pane of glass
Evidi has created the ideal suite of dashboards for MSPs – a customer health overview dashboard that drills into one workspace per customer. Learn more.


Latest blogs
3 powerful tools for reporting Azure DevOps metrics
Compare Azure DevOps dashboards, Power BI, and SquaredUp. Learn why SquaredUp offers the best balance of power and ease of use.

Dashboards vs. Boards in Azure DevOps: A comparative guide
What's the difference between Dashboards and Boards in Azure DevOps? Let's take a look at when and how to use each feature most effectively.

Identifying VMware underutilization using SquaredUp dashboards
How to proactively identify underutilized resources in VMWare using SquaredUp dashboards. Easily and quickly reduce wastage.
10 metrics every Azure DevOps engineer should monitor
To help you stay on top of things as an Azure DevOps engineer, here are 10 key metrics to keep a close eye on.

Introducing Workspace Icons
Workspace Icons make your workspaces instantly recognizable and add context and meaning when looking at the map or rolled-up view.

Deep dive into any tile – introducing our Data Explorer 🔎
With the Data Explorer, users can dig into the data behind any tile and slice, dice and explore as needed.

How to visualize Azure Resource Graph data with KQL
Learn how to query Azure Resource Graph with KQL to visualize change history, Azure service health and maintenance schedules.

Notifications feature deep dive
Notifications is one of the most frequently used features of SquaredUp. Let's take a look at some of the design decisions behind the feature.
Introducing dashboard variables
You can now create just one dashboard to be reused across all your objects of the same type – be it your pipelines, apps, or microservices!

Announcing... Markdown magic ✨
We're excited to share a small but mighty new feature. Our Text tile now supports Markdown! Easily add headings, links, lists and images to your dashboards.

Unlimited dashboard sharing explained
Senior Product Manager, Vincent Babin, shares some design decisions behind our popular dashboard sharing feature and explains how it works.
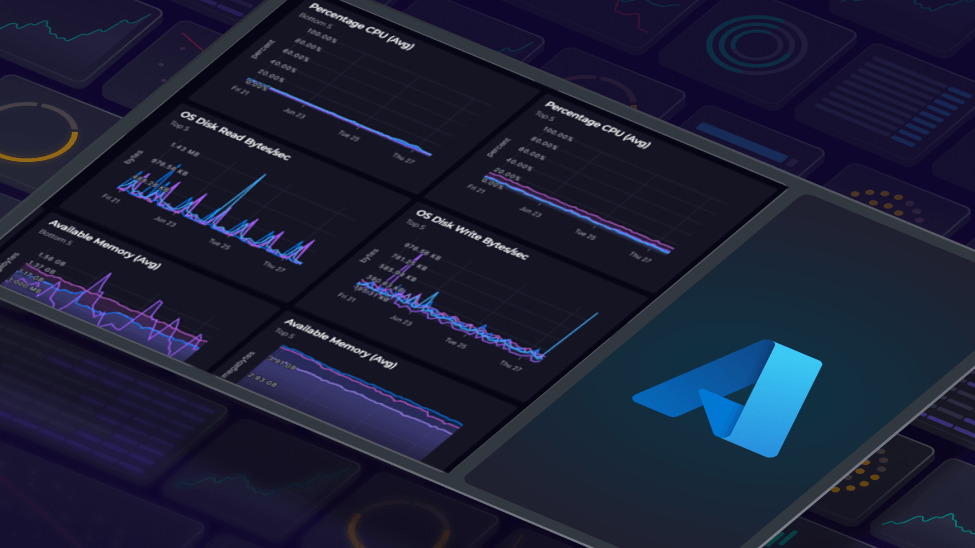
Azure Virtual Machine out-of-box dashboard makes it easier to get started
Our out-of-box Azure VM dashboard helps you identify performance issues, optimize resource usage, and maintain overall health.
