Noorul Huda N
DevRel Engineer
What makes a good dev team dashboard? Read to see what metrics to include across your team's tech stack.
Most developers spend too much time digging through tabs and switching between tools, rather than actually writing code. According to an IDC survey, only 16% of their week goes to coding, while the rest is lost to what researchers call “organizational inefficiencies” – all those little things that slow teams down.
The challenges aren’t new: information is spread across too many tools, constant context switching, unclear priorities, and technical debt that slips under the radar until it becomes a problem. The outcome? Teams have data everywhere, except where and when they actually need it.
It doesn’t have to be that way. Instead of developers wasting time chasing updates, why not bring the right answers into the tools they already use? A well-designed dashboard gives teams a live, focused view of what matters most, so they can spend their energy building, not searching.
Let’s say a development team is using AWS for infrastructure, Azure DevOps for CI/CD, GitHub for code, Jira for issues, and AWS CloudWatch for monitoring. With everything siloed, each day involves jumping between apps and piecing things together.
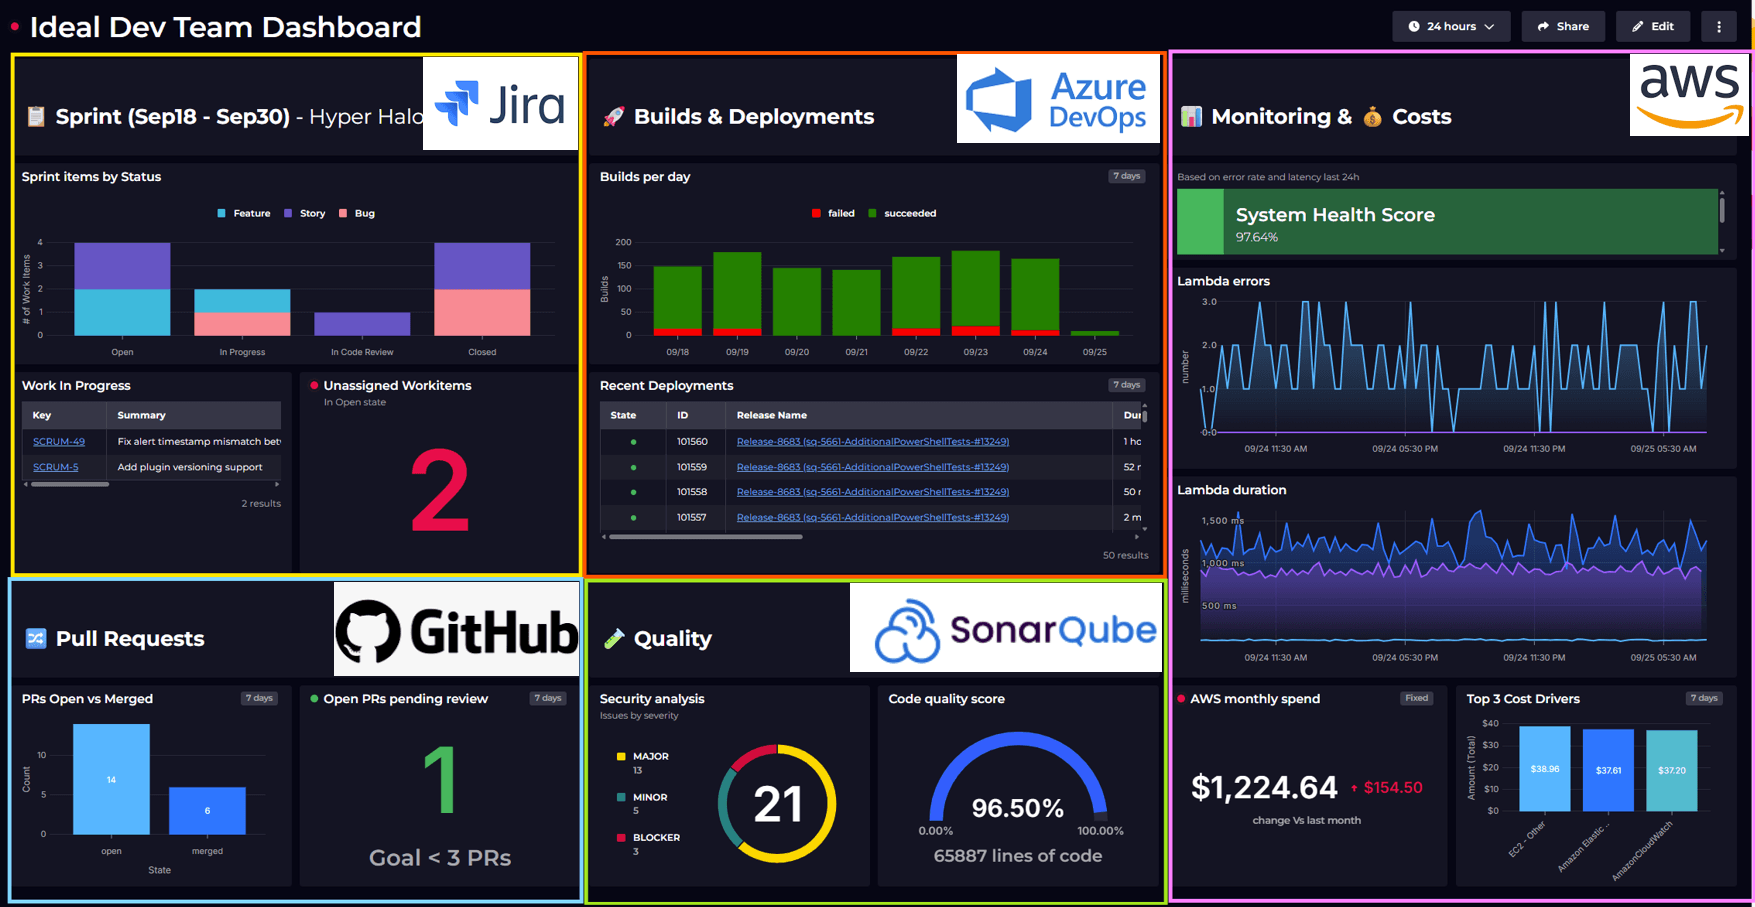
A good dashboard pulls it all into one place – backlog progress, open pull requests, release status, system health, so the team has what they need at a glance. Let’s take a look at one that does just that.
Here, pulling from Jira, Azure DevOps, AWS, GitHub and SonarQube, we’ve got a dashboard that displays our sprint progress, pull requests, builds & deployments, monitoring, costs, and code quality metrics.

Read on to see a breakdown of what metrics we've chosen to display.
Alternatively, check out this video if you'd prefer to watch me talk through the dashboard and each decision we made.
This view uses Jira datasource, providing a concise summary of current sprint work items.

Sprint items are grouped by status and issue type using a JQL query, visualized in a stacked bar chart for easy understanding.
The Work in Progress tile shows all active tasks, giving developers real-time visibility into ongoing work.
The Unassigned open work items are shown to highlight any gaps, with monitoring set to alert the team if any count exceeds zero.
This is integrated with Slack to notify the dev team channel immediately about any unassigned issues.
This view aggregates pull request data from GitHub, showing open vs. merged PRs to track development flow.
It also displays open PRs awaiting review, with monitoring alerts for any pending items requiring quick action.

This displays build activity relevant to the sprint, including builds per day and recent deployments, providing visibility into pipeline health and delivery status.

This view tracks code quality by highlighting issues and presenting a quality score.

Data is pulled via Web API datasource – using the issues endpoint for security analysis and measures endpoint for code quality score. This helps team keep technical debt in check.
Metrics here monitor application health-tracking Lambda errors, response times, and more. Cost data displays the financial impact of technical decisions, encouraging developers to make more cost-conscious choices through increased visibility.

The dashboard summary is automatically sent every Monday to the team’s Slack channel, covering sprint progress, key metrics, and blockers –removing the need for manual updates.
Documentation for setup is here: Automate your weekly dev team dashboard in slack with SquaredUp and Power Automate
For scaling across teams, Terraform manages dashboard configuration as code to automate new deployments, eliminating repetitive setup work.
More on Terraform here: Terraform Registry
According to the Atlassian State of Teams report, with easy access to all the information they need, development teams become:
Build your dashboard and see what a difference it can make for your team. Start creating your dashboard for free.
DevRel Engineer


Getting started with SquaredUp is free and easy. Our free tier includes: