Blog

We did it! SquaredUp is now a B Corp
It's been a journey - but we're delighted to finally announce our B Corp certification. Here's the story of how it happened...
Top 5 dashboards for DevOps leaders
How DevOps leaders can use SquaredUp to view SLOs and key metrics in a single pane of glass.
Operational Intelligence - the new horizon of observability
The evolution of observability into intelligent, real-time decision-making.

How Evidi built the perfect MSP single pane of glass
Evidi has created the ideal suite of dashboards for MSPs – a customer health overview dashboard that drills into one workspace per customer. Learn more.


Latest blogs
Azure DevOps success with out-of-box dashboards & monitoring
Learn how our out-of-box Azure DevOps dashboards can turbocharge your pipeline management. We display the trends so you can proactively solve issues.
How to build an Azure carbon emissions dashboard
A step-by-step guide on how to build an Azure carbon emissions dashboard. We also cover how to connect to the Azure carbon APIs.
Are dashboards dead? Not quite. They just need to evolve
Dashboard tools need to provide operational intelligence for all, and that is a whole world away from the dashboards of the past.
Introducing our Terraform provider: Dashboards as Code
Ever wished you could automatically generate a dashboard at the end of your CI/CD pipeline? Introducing... SquaredUp Dashboards as Code!
Objects and queries explained
Curious about objects and queries, and how they might impact your SquaredUp subscription cost? This article reveals all.

A dive into health roll-up
SquaredUp dashboards sit on top of some very powerful technology. Read to learn all about our health model and how it can benefit you.

How to build AWS CloudWatch dashboards: a complete 2025 guide
Build powerful AWS CloudWatch dashboards in minutes. Monitor multiple accounts, integrate with your full tech stack, and share insights across teams. Free guide + templates.

Highlights from Experts Live India 2024
Experts Live India was yet again a huge success! This is a first-hand account from Noorul, a SquaredUp Support Engineer who helped organize the event.

Our 2023 highlights
Read this collection of our favorite company and community content from the last 12 months. Slight Reliability episodes, product updates and more!

Context isn't just for Christmas
Can our customer North Pole Industries pull off Christmas Day in their Tesla-powered CyberSleigh, with the help of SquaredUp dashboards?

Introduction: Sameer's SQUP learning path
After his long sabbatical, we're thrilled to welcome Sameer back to SquaredUp. Join him on his journey to discovering what SquaredUp is really capable of.
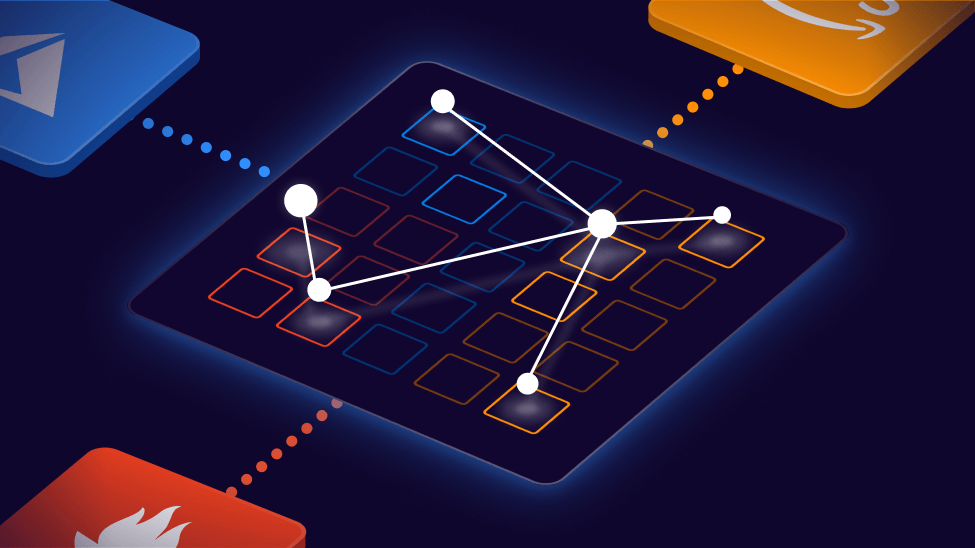
Correlate AWS and Prometheus with SquaredUp's data mesh
Discover how to consolidate data and give it context with the Prometheus and OpenTelemetry plugins in SquaredUp!
