
Incident response
Know where to go when things go wrong
Enable incident responders to efficiently escalate to the right team without dragging everyone into a war room. Incidents get resolved faster and engineering teams stay productive.
Diagram your app
Capture knowledge of your systems in one place – from dependencies to service owners.
Surface status
Plug into your observability tools to quickly determine the health and performance of components.
Drilldown
Jump into the details and combine data from across tools to determine root cause.
Request a demo
- 45 min
- Web conference
Meet our Product Advocate team, your #1 source of knowledge while you're getting to know SquaredUp.
Continue exploring
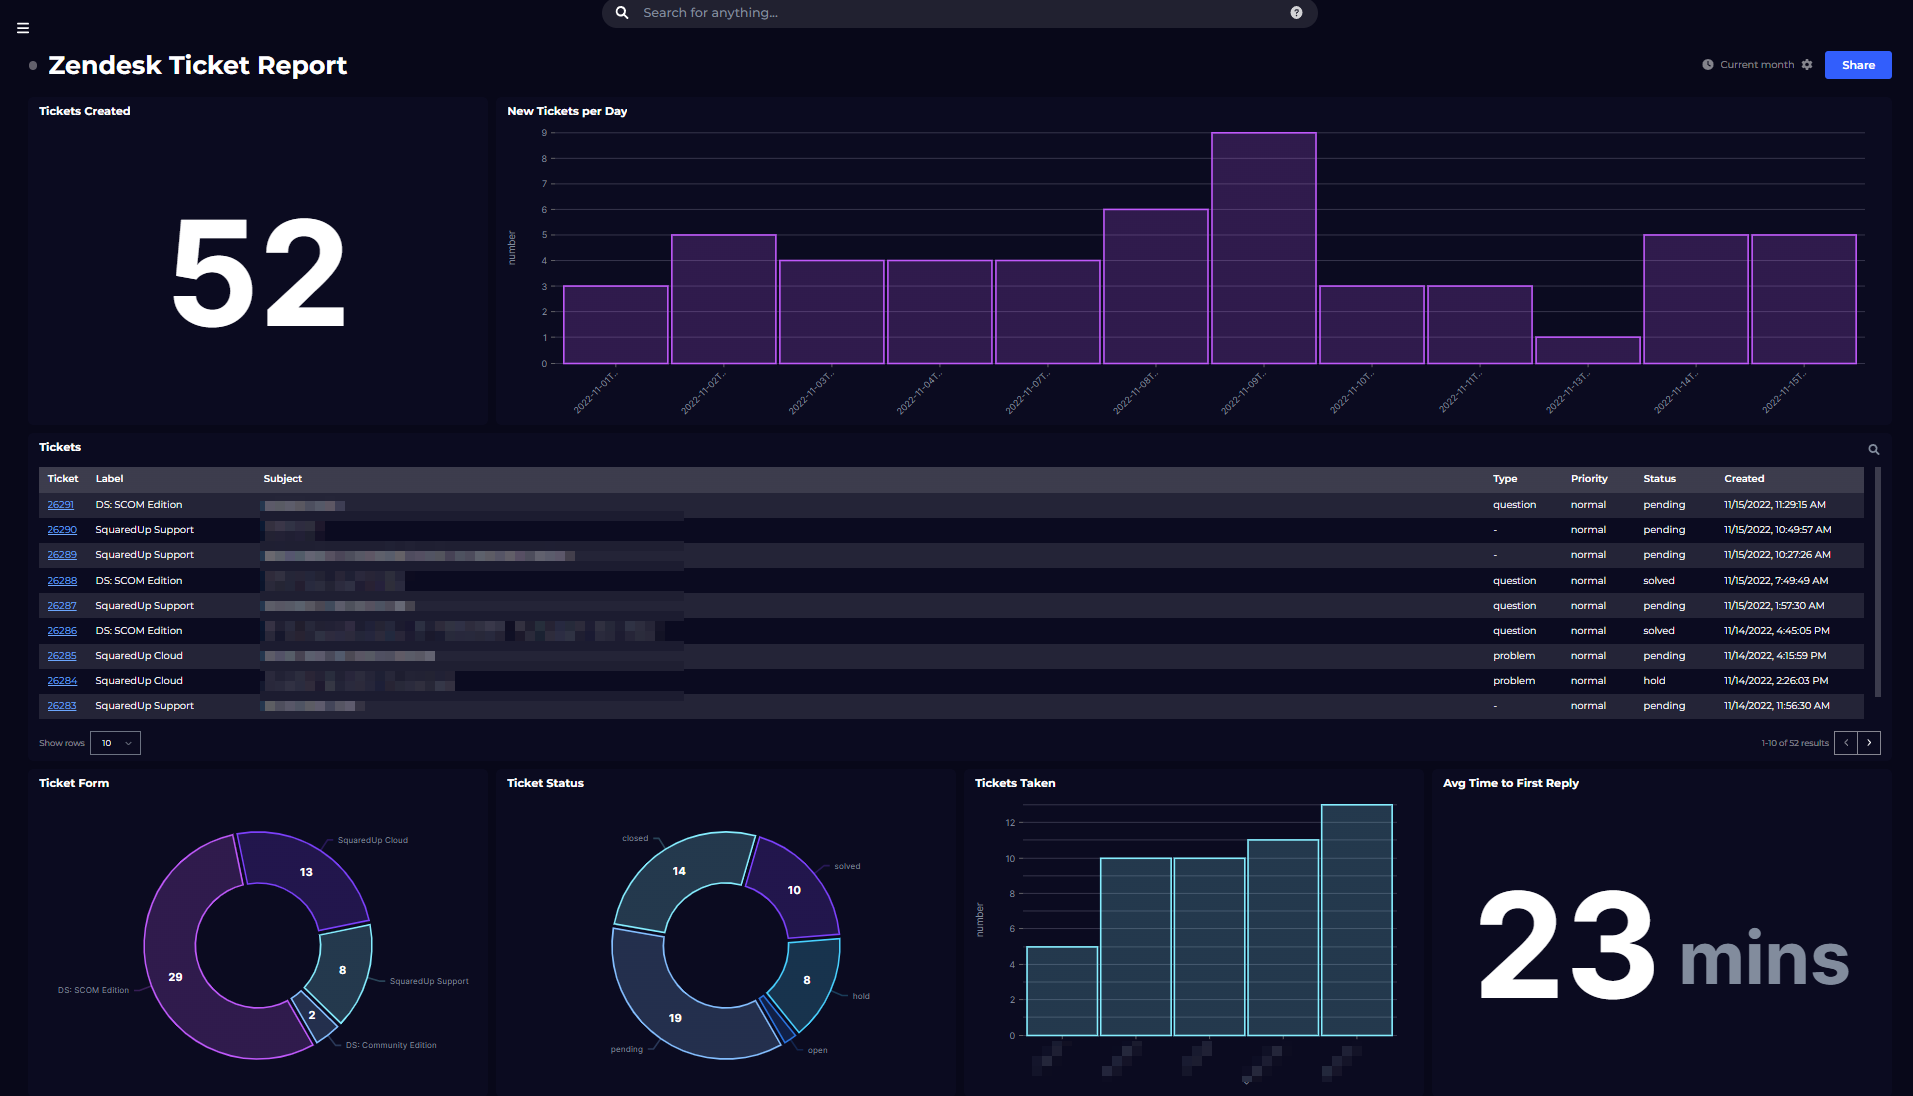
Dashboard Story
Zendesk ticket summary dashboard
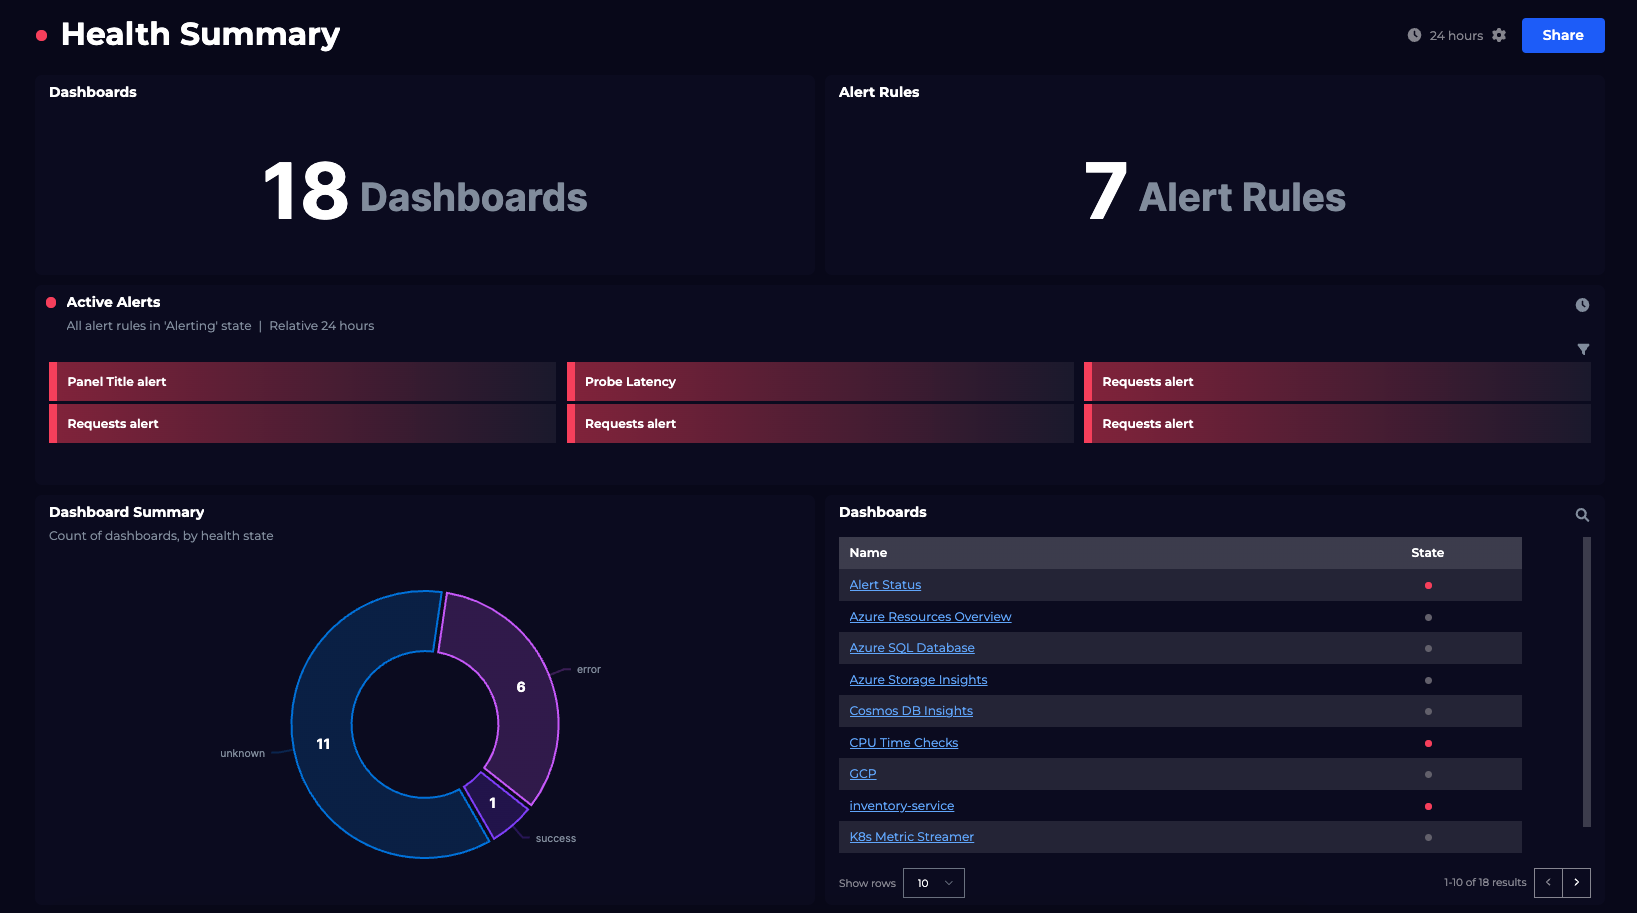
Dashboard Story
Grafana health roll-up dashboard: A big-picture overview
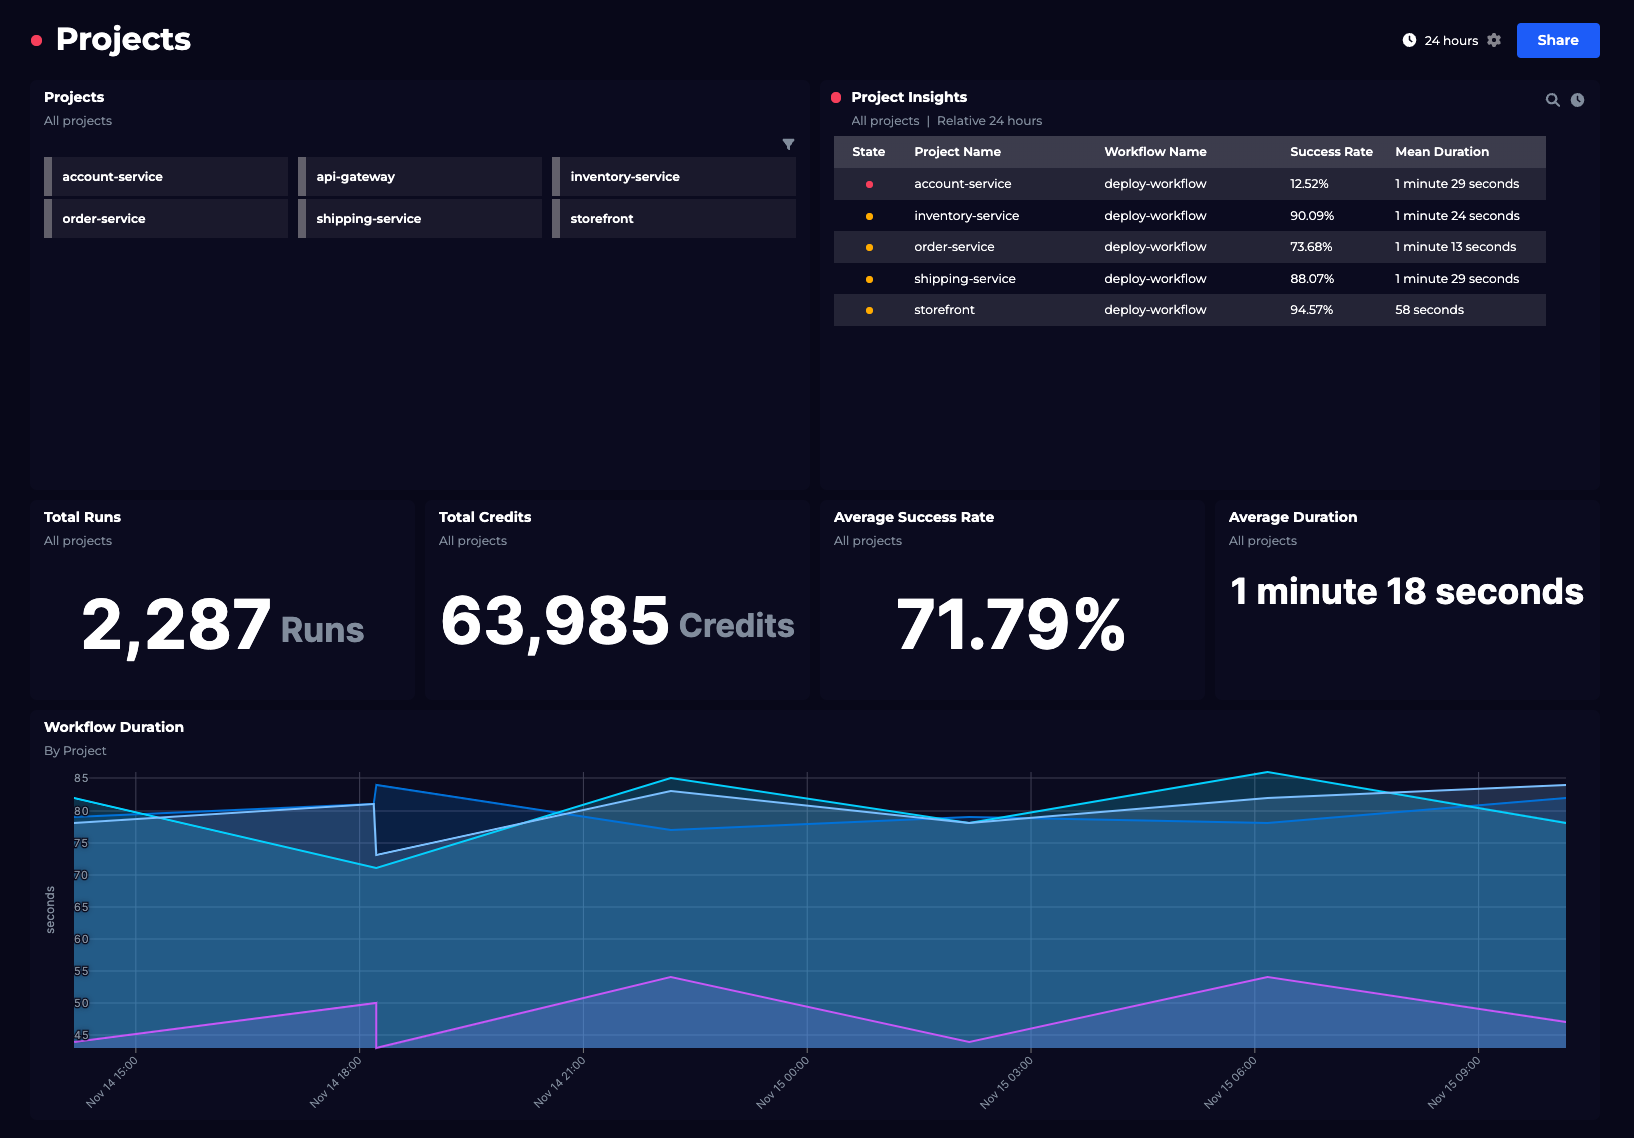
Dashboard Story
CircleCI dashboard
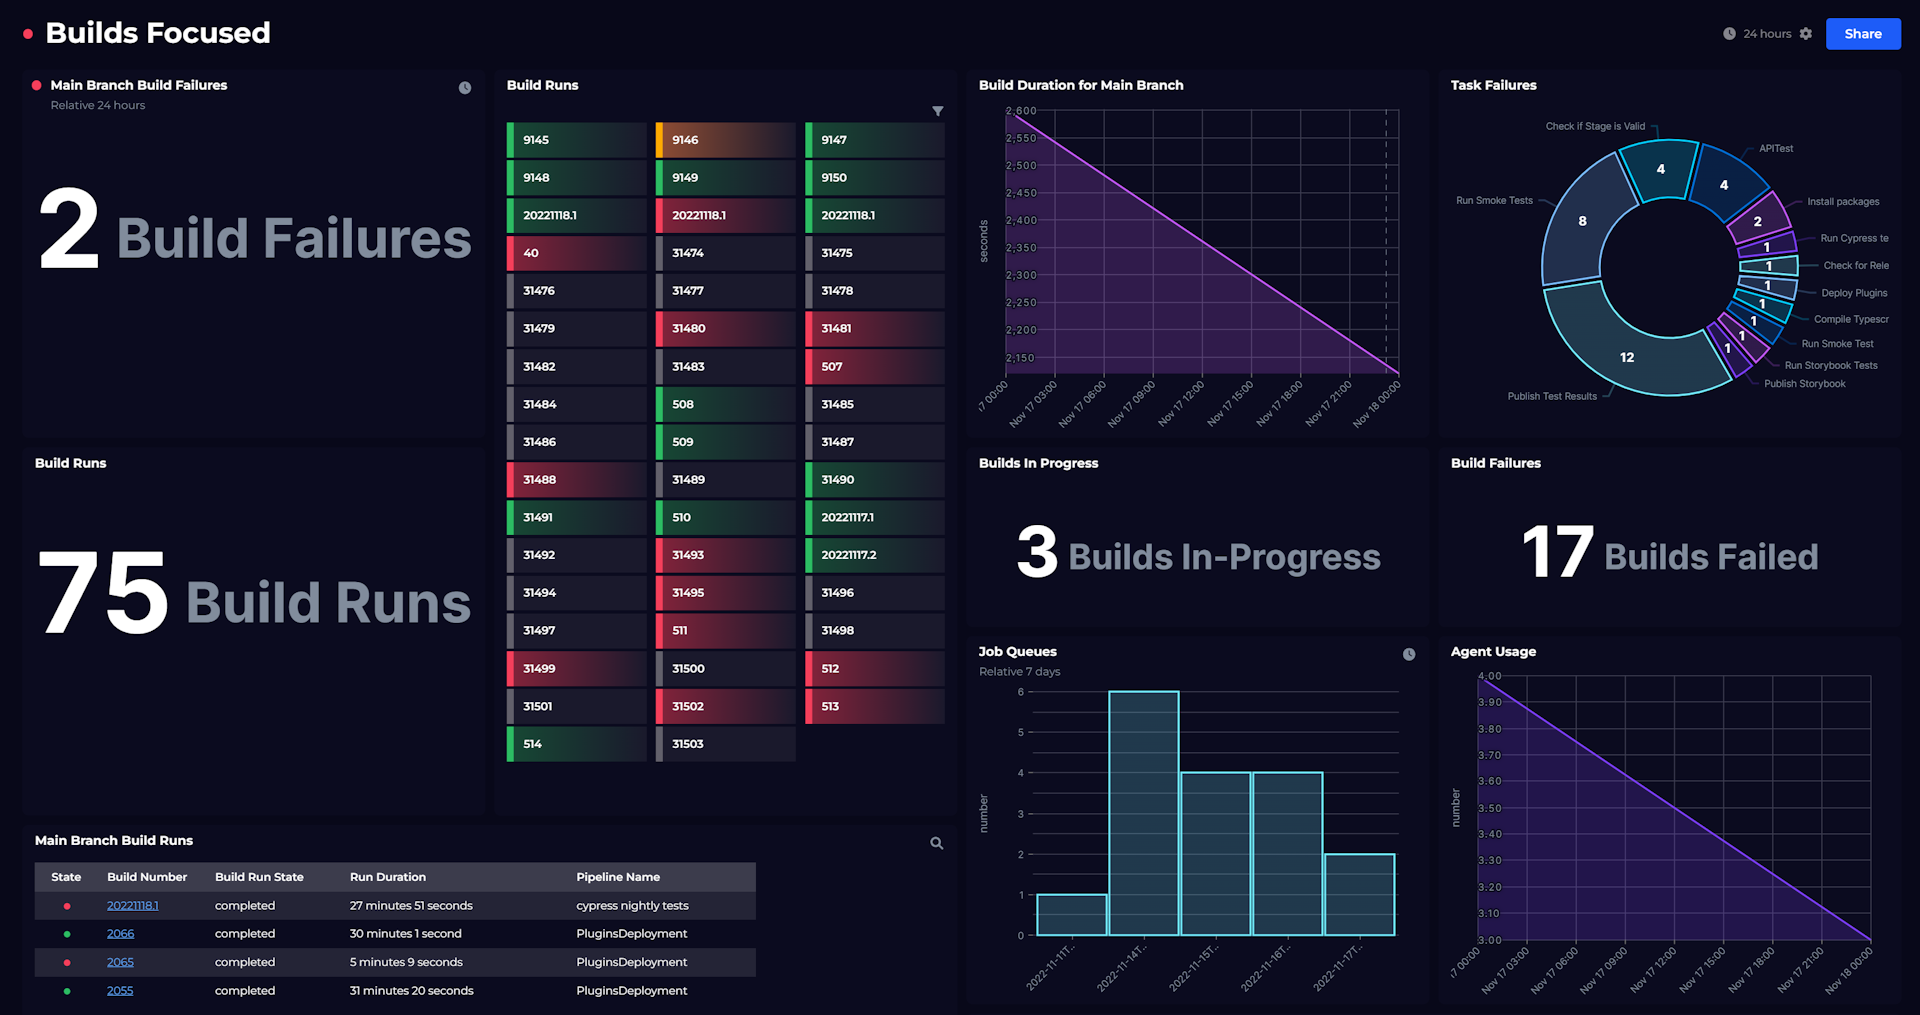
Dashboard Story
Azure DevOps dashboard
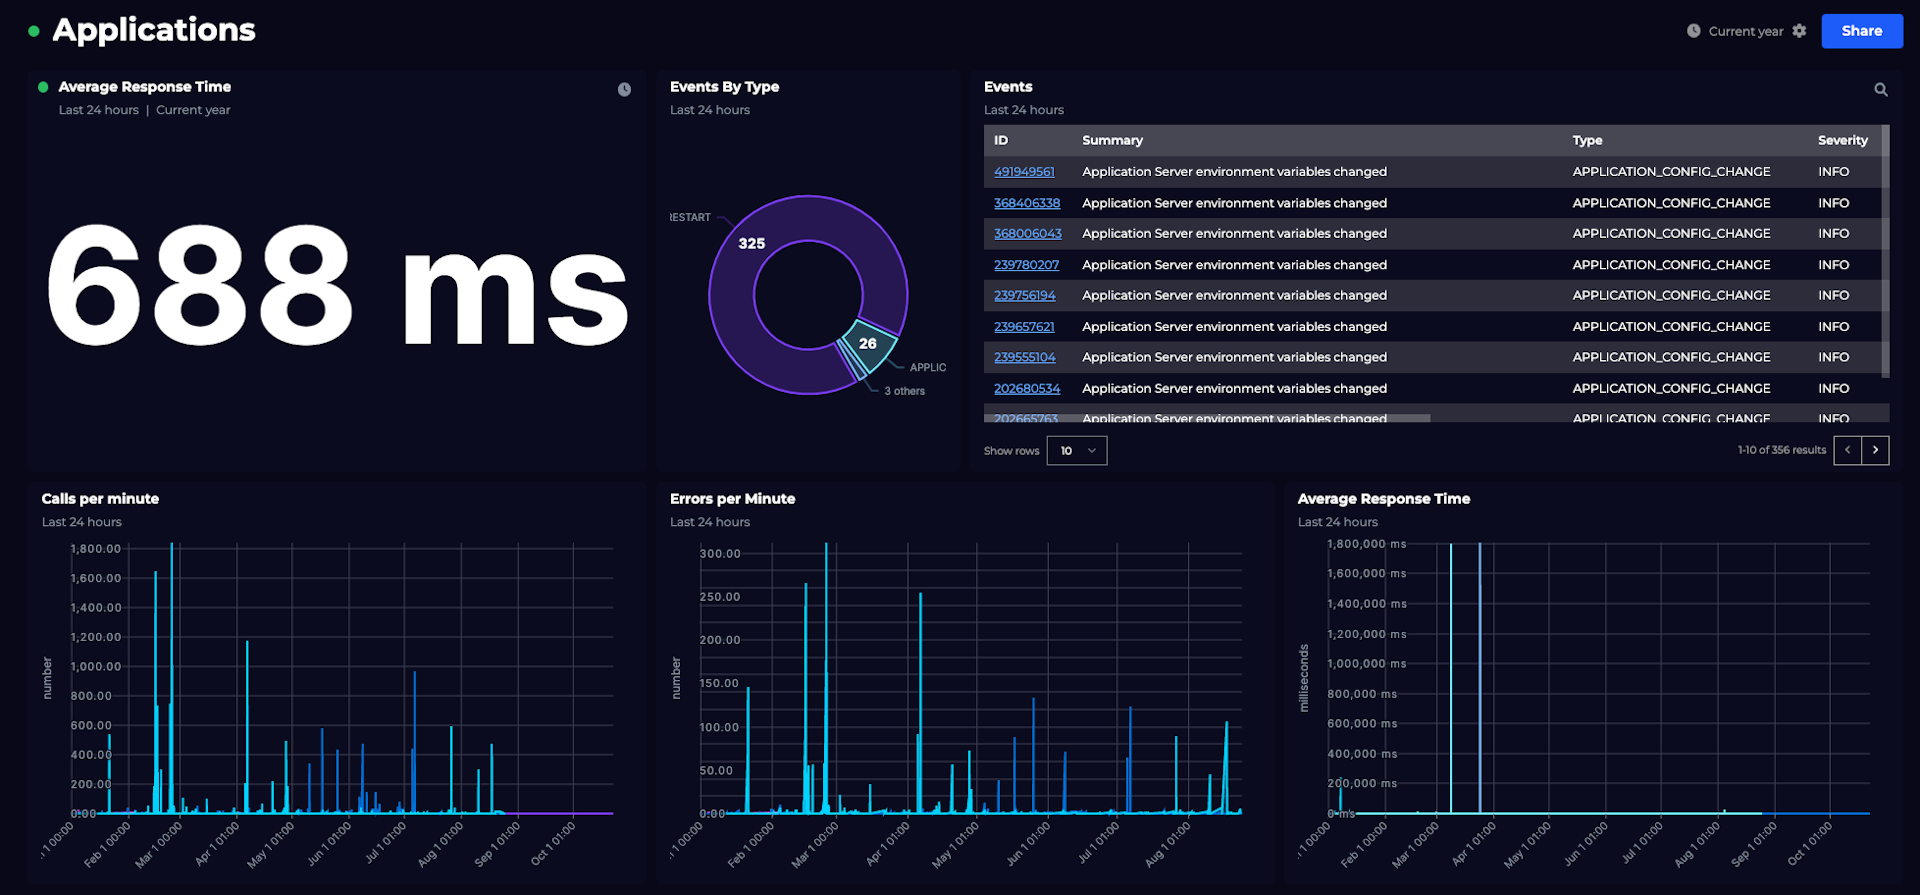
Dashboard Story
AppDynamics service health and performance dashboards
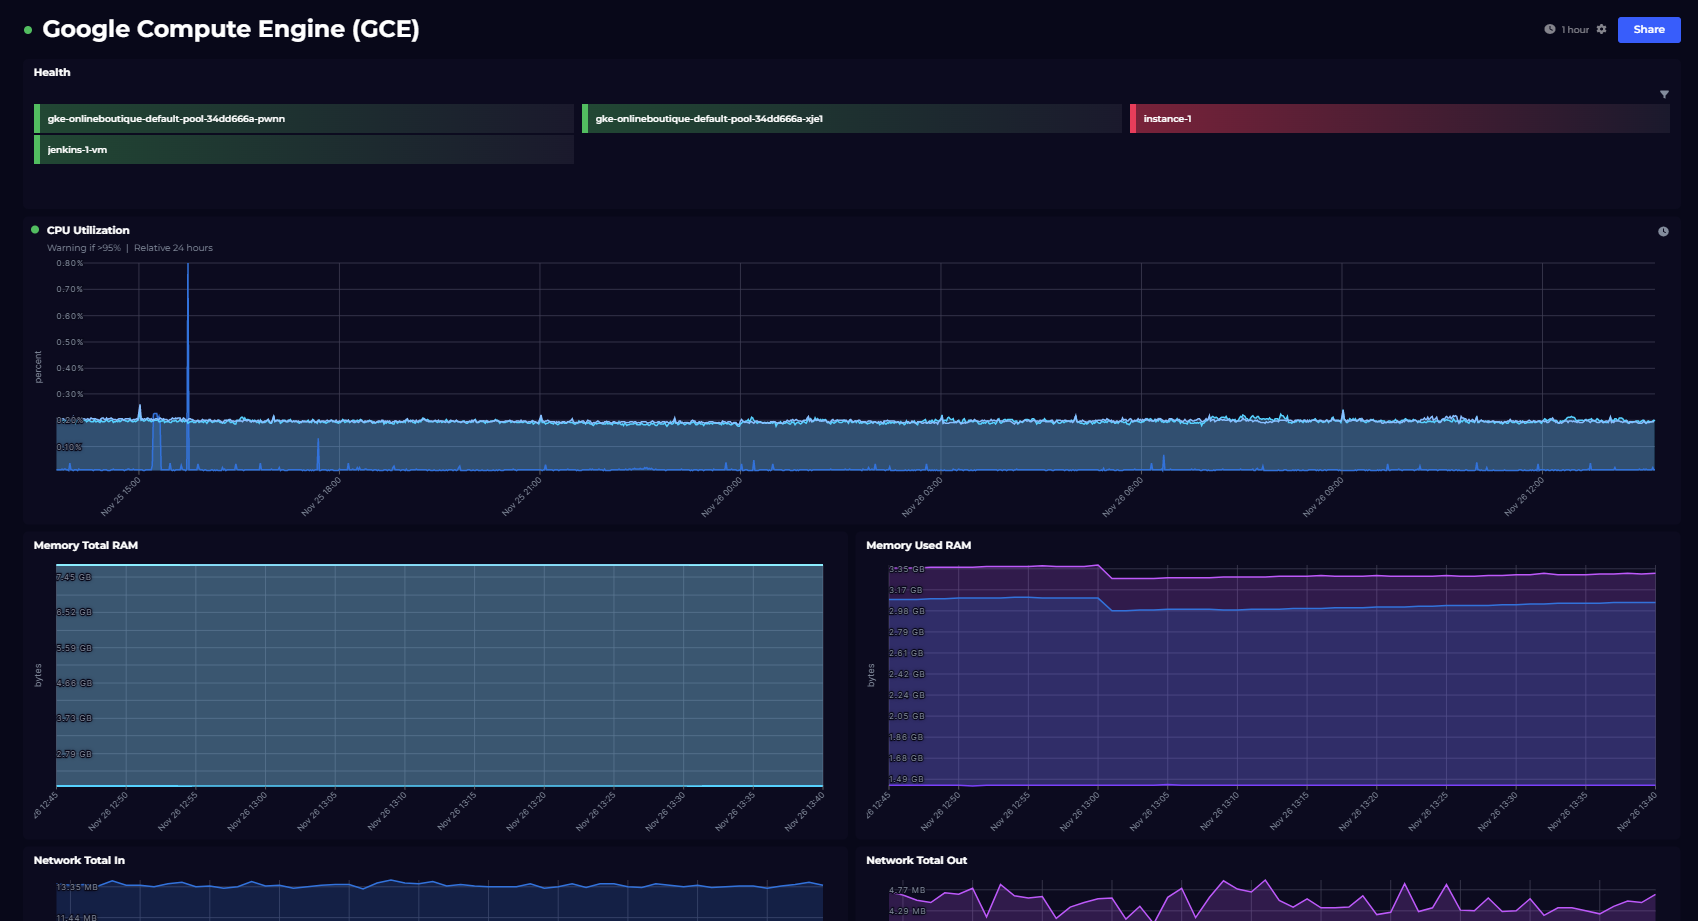
Dashboard Story
Google Compute Engine dashboard: VM health summary
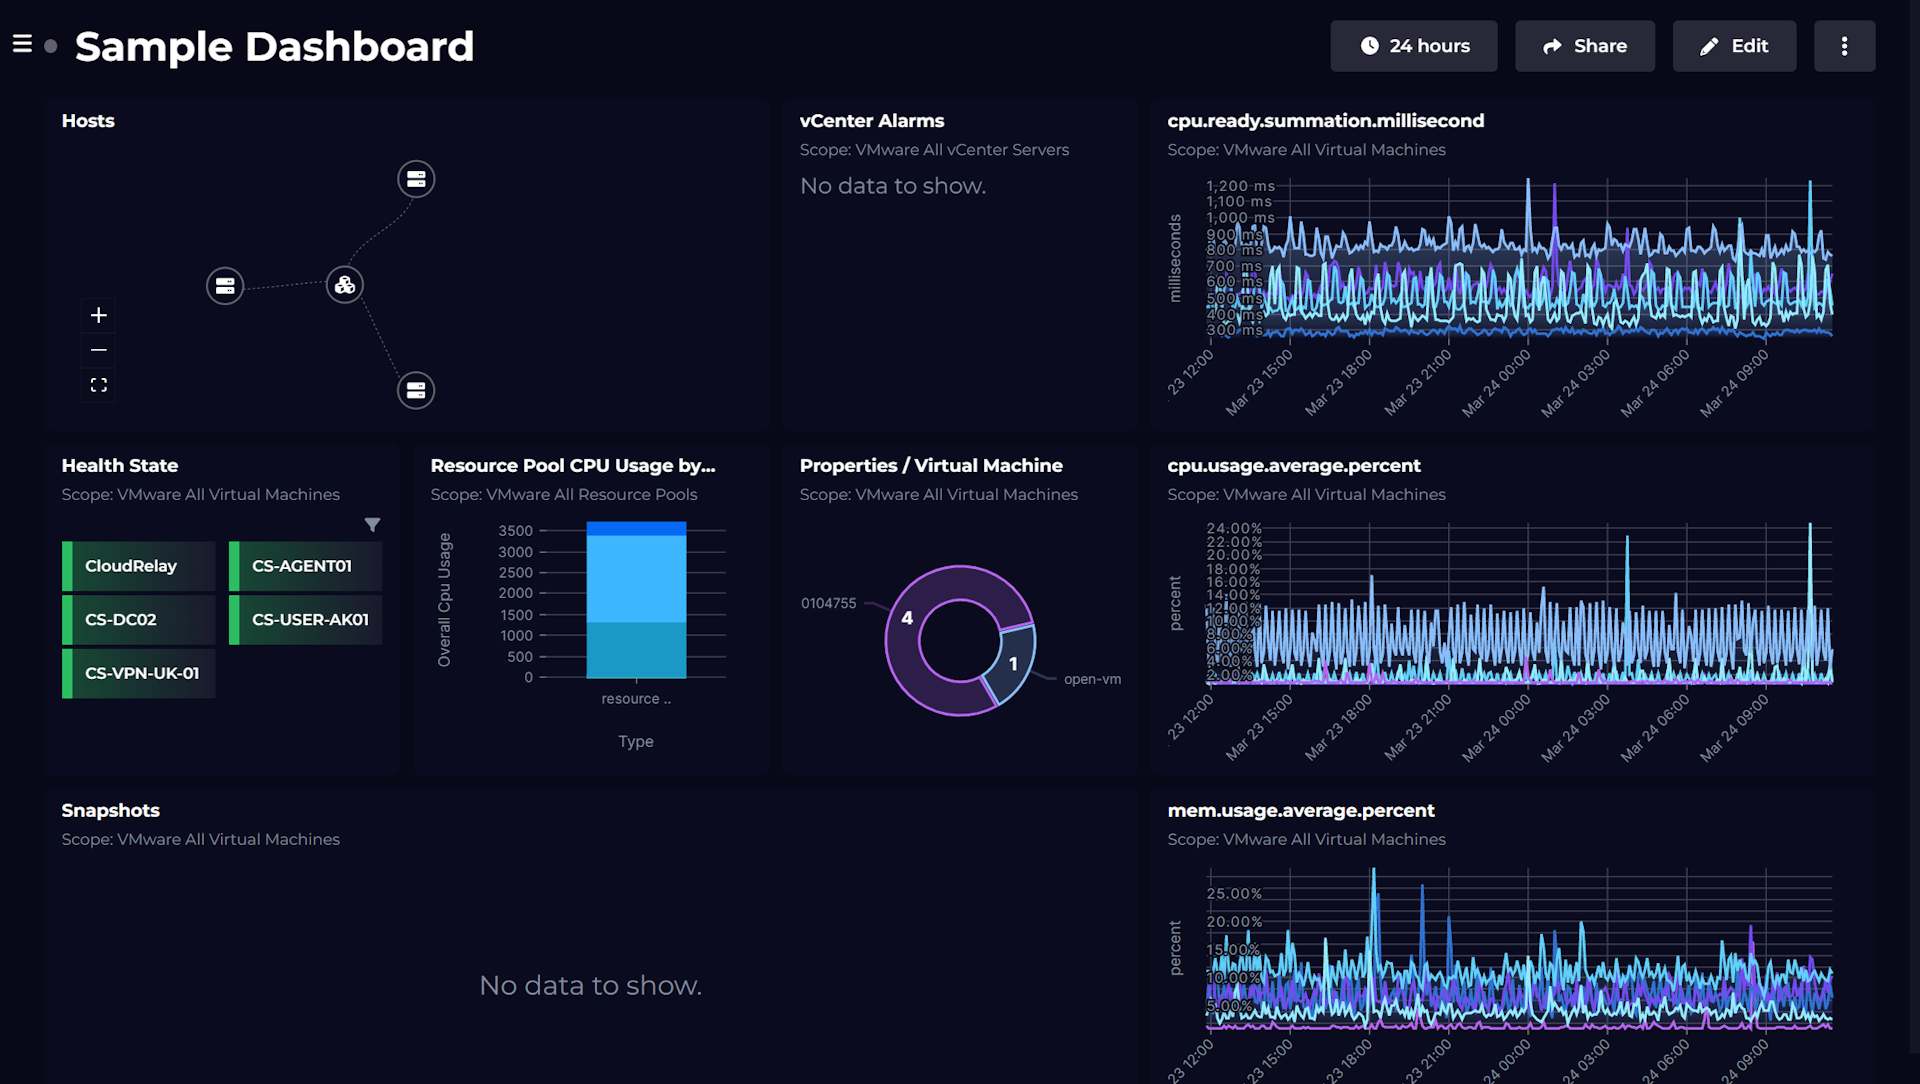
Dashboard Story
Consolidated VMware health and performance dashboard
Dashboard Story
AWS infrastructure monitoring dashboard
Dashboard Story
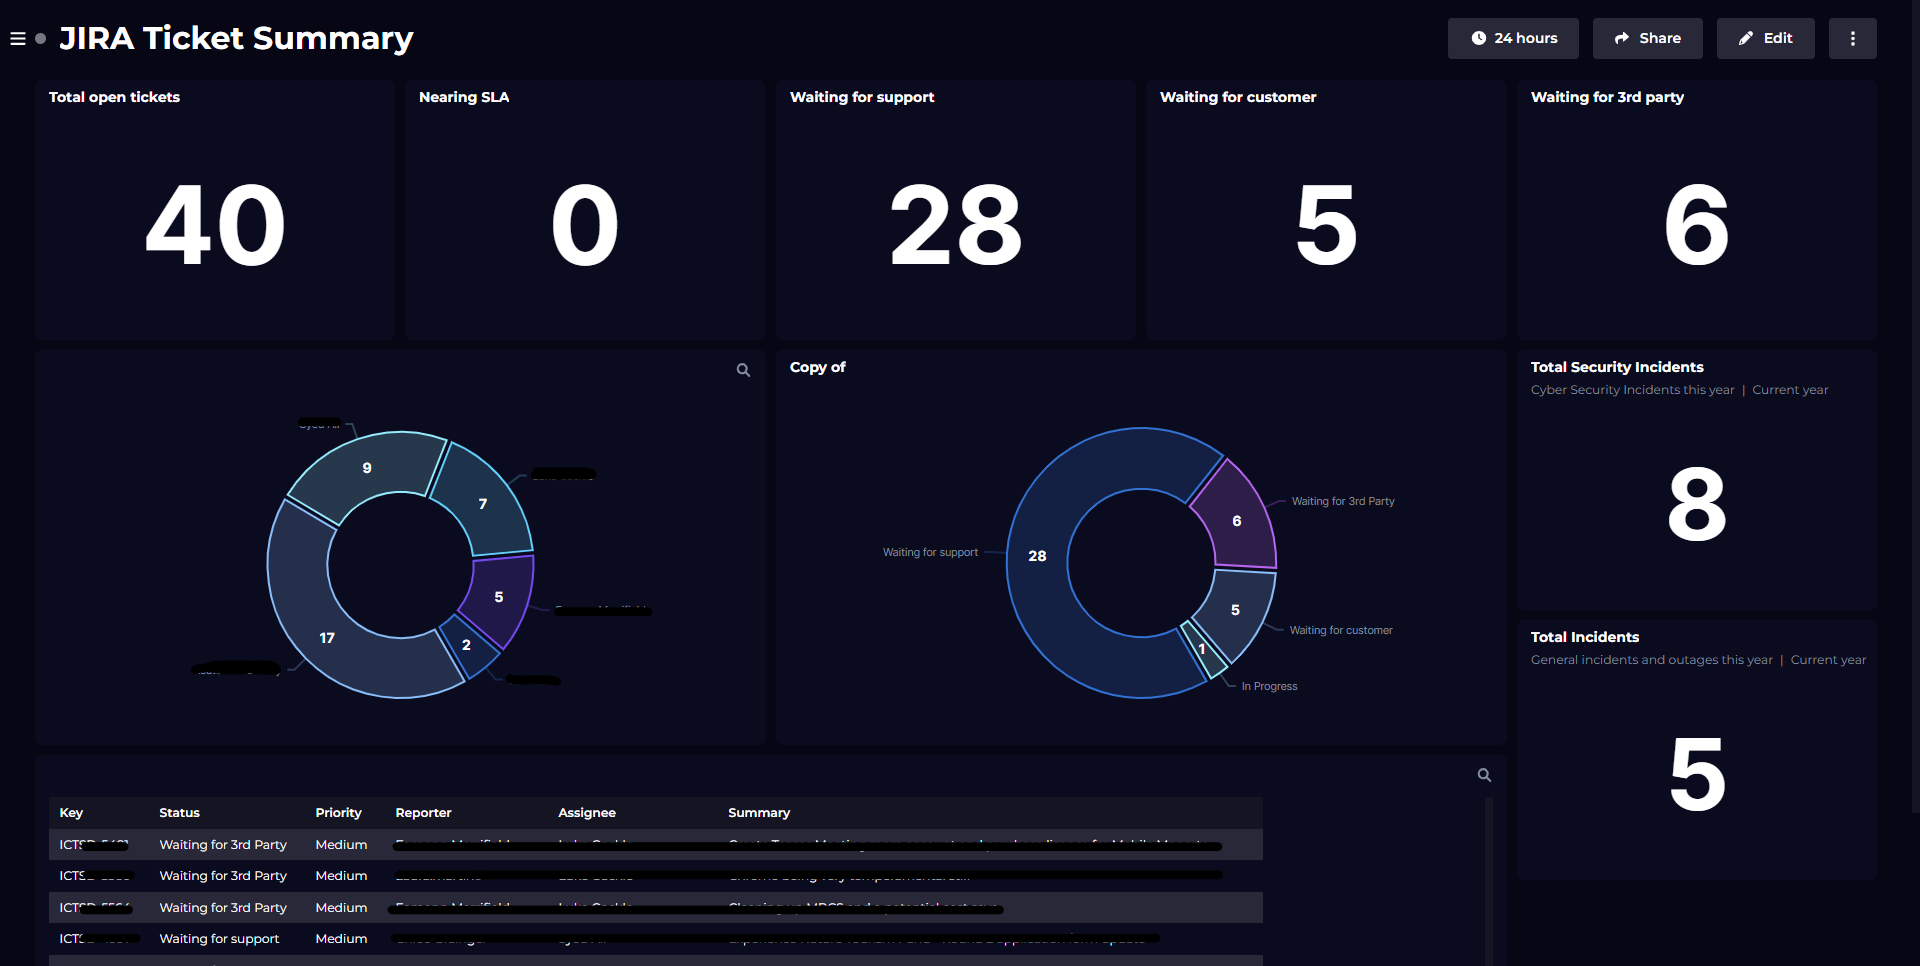
High-level Jira ticket summary dashboard


Plugins for Incident response

AWS
Monitor your AWS environment, including EC2, Lambda Functions, CloudWatch and more.

Zendesk Support
Monitor your Zendesk Support tickets.

Pingdom
Monitor the health and performance of your Pingdom Checks.

CircleCI
Monitor the Pipelines and Workflows from your CircleCI environment.

GitHub
Monitor the Incidents, Issues and Pull Requests from your GitHub environment.

PagerDuty
Monitor the Incidents and Alerts from your PagerDuty environment.
SquaredUp has 60+ pre-built plugins for instant access to data.
One platform for all your engineering insights

SLO reporting
Any data source Measure SLOs independently of where the data is stored and collected for complete flexibility. Roll-up across silos Engage engineering teams by giving them control and visibility of their own SLOs, with a centralized roll-up. Business-aligned Correlate engineering SLOs with customer and business outcomes to focus on what really matters.

Status roll-up
Plugs into anything Plug into any tool, on-prem or cloud, and surface real-time status. Connects silos Play nicely across teams – a central view with delegated control. Beautifully simple High-level summary status, perfect for a morning dashboard check.
